Waste Operations Dashboard
One live view of collection, processing and performance across the city.
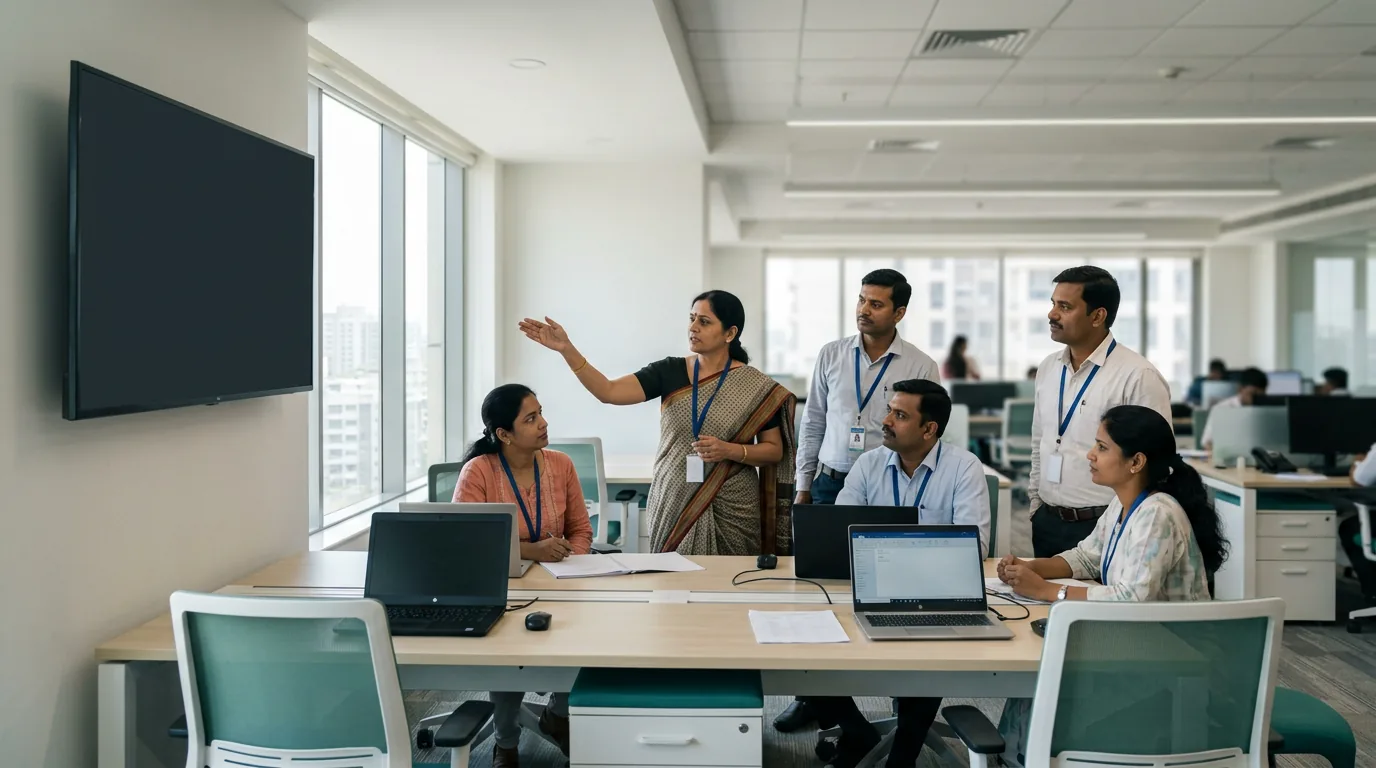
An operations dashboard brings vehicle tracking, coverage, segregation, processing throughput and complaints into a single live view — so leadership can see performance and act, and evidence is ready for assessment.
- You cannot manage what you cannot see
- It surfaces underperforming wards and routes fast
- It doubles as Survekshan / GFC evidence
One live view of the whole system
You cannot manage what you cannot see — a single view of collection, processing and complaints turns scattered field data into leadership decisions.
A clear, practical approach
The metrics that matter: coverage, segregation, processing, complaints.
GPS, weighbridge and field data feeding the dashboard.
Dashboards for leadership and ward officers with review cadence.
Related work we've delivered
Real projects behind our collection & operations — named partners, measured outcomes.
Transforming Solid Waste Management at Dwarka, Gujarat
Dwarka, Gujarat
Creating a Garbage-Free Slum in Wadarwadi
Wadarwadi, Shivajinagar ward, Pune
Building a Net-Zero, Climate-Resilient Mandede Village
Mandede Village, Taluka Mulashi, Pune district
Related services
Waste Operations Dashboard — quick answers
The essentials, then talk to us for your specifics.
Talk to our team →What is Waste Operations Dashboard?
Who needs Waste Operations Dashboard?
How does Social Lab deliver Waste Operations Dashboard?
Explore the rest of our waste-circularity work — by service, by who you are, or by where you operate.
Latest thinking on this
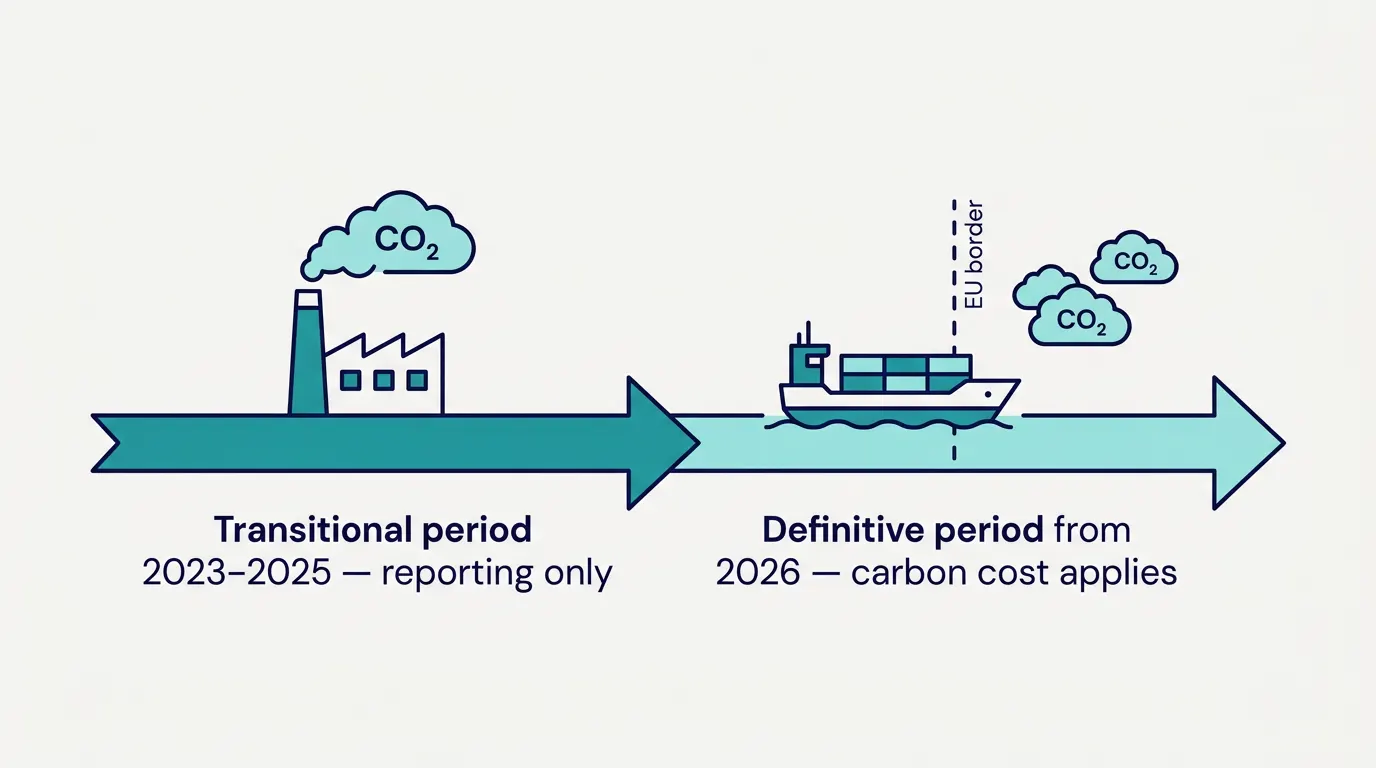 Waste CircularityIndia's Circularity Leap: Key Learnings for Waste Management in 2026As India accelerates its transition to a circular economy, businesses and municipalities must adapt. Discover critical waste circularity learnings for 2026.
 Waste CircularityMaterial Sovereignty in India: Building Resilient Circular Supply ChainsIndia can strengthen material security by connecting smarter design, EPR, urban recovery, recycling quality and demand for verified secondary materials.
 Waste CircularityBuilding a Circular City: A Solid-Waste Roadmap for ULBsA practical, phase-by-phase solid-waste roadmap for Indian ULBs to move from disposal to circularity, aligned with SWM Rules 2016 and SBM-U 2.0, covering the full value chain from segregation to scientific disposal.
Need waste operations dashboard?
Tell us where you are and we'll scope it — baseline to measured impact.
Or call +91 95794 42142 · [email protected]